
- 13 February 2017
- Visualisation
- #R, #Shiny, #platform, #Visualisation
After discovering R last month, I had to try Shiny. Over the past years, I've done many user interfaces:
- Landscape Digital Atlas of Denmark,
- 1 year result of a mapping survey I had designed,
- an advent calendar with a d3-graph a day,
so it was tempting to try Shiny. Interaction without JavaScript? I love JavaScript, but I want to see how that can work!
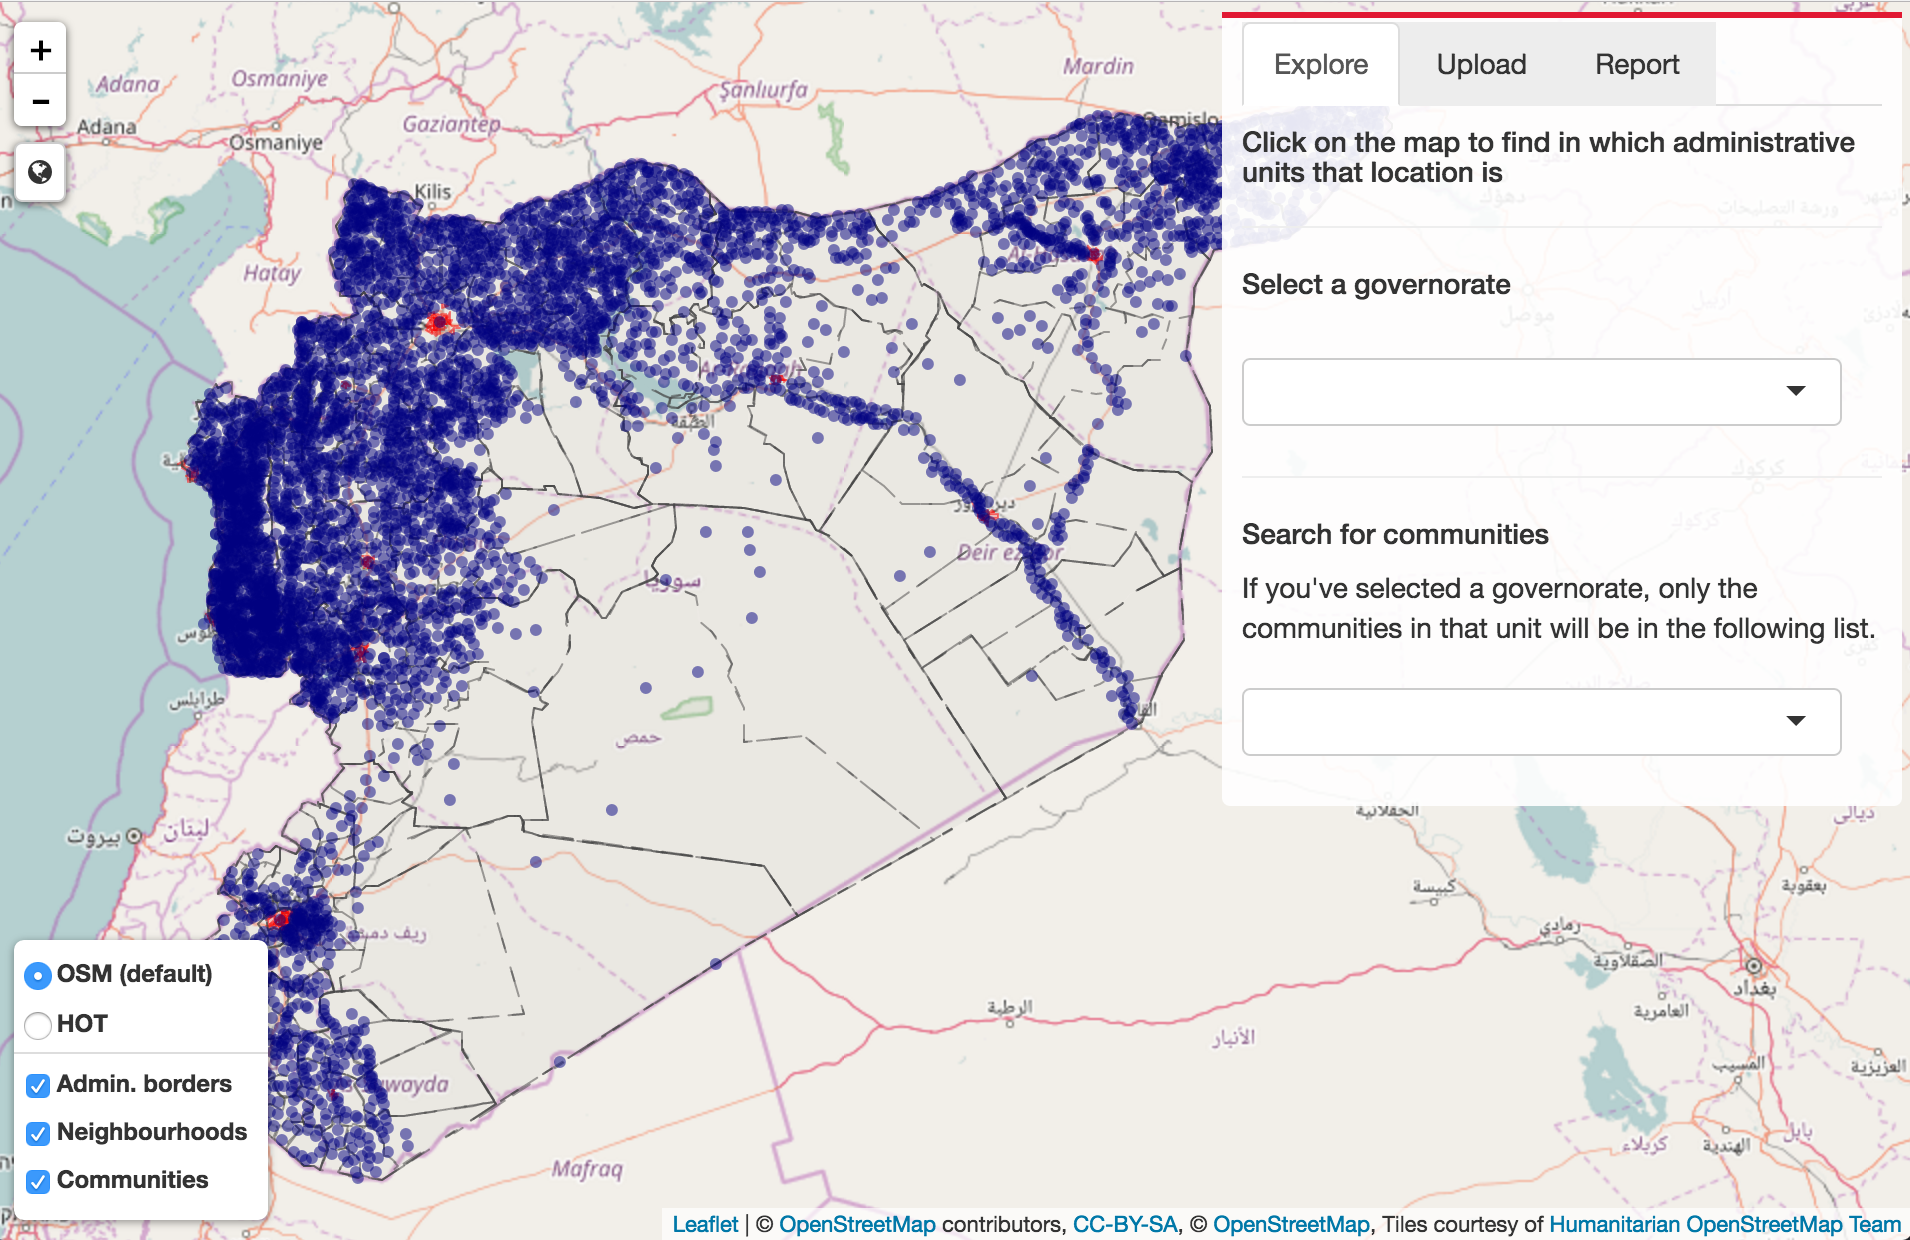
Since I'm largely geo-biased, I was happy to make a map interface for the UN in order to map reports of what is happening in Syria. I used Leaflet for R, which I've used in the past as a JavaScript library, and created this very simple Shiny app.
In this blog post I present the app I've built, the data I used, and the interface. I then explain how I speed up the map, and then I conclude with my impressions of Shiny.
0. Overview
The app has two main objectives:
- Being an interface for the administrative borders of Syria for the team in charge of recording the reports
- Mapping the Excel reports to explore them using filters for date and some themes.
I also tried to code the export in KML but unfortunately there seem to be a bug with the KML module of OGR package. I managed to export as a shapefile, or geojson, but these are not format that are easy to use without a proper GIS software (GoogleEarth may be borderline GIS software, it is only borderline in my opinion), so I moved into creating a better interface so the team would not need to use GoogleEarth.
1. The data
I used the data available at Humanitarian Data Exchange to show the 3 levels of administrative borders (Governorate, District and Subdistrict), and the communities.
Administrative level
The data is relatively heavy, so I transformed it in topojson, and combined the three layers into one. Topojson is such a life saver when making webmap with accurate data!
I first renamed the fields from NAME_EN (they all had the same name) to the name of the layer (governorate, .. ), removed all the other fields, and then used the mapshaper tool, to combined them all together with the following command line:
mapshaper -i syria_adm1.shp syria_adm2.shp syria_adm3.shp combine-files -o syria.topojson
Communities
The data provided by HDX contains the cities as polygons or points (the geographic center of the city). I thought of including the cities as polygons, but to make the application lighter, it is better to have them as points.
2. The interface
In making map dashboards, I always ensure that the users can find their way through the map. This means providing multiple basemaps and layers, data query tools, but also adding enough tools to navigate the map, for instance using a "Back Home" button. I also like making sure there are feedback with dynamic text or highlights, but it's a little bit more clunky in pure R.
Layers
- Basemaps
I selected two basemaps: the OSM (OpenStreetMap) and the HOT (Humanitarian OpenStreetMap Team): they don't have too much details, with faded colors, so it's possible to add more layers on them; and they have enough information to give a good context to the data.
- Overlay maps
Overlay maps are the layers specific to Syria: two topojson files for administrative areas and a csv point file.
Mapping tools
The mapping tools include zooms "in" and "out". Leaflet for R doesn't yet provide out of the box option to move the zooms in either corner of the map, so I kept them in the top left corner. I added an actionButton:
actionButton("gobackhome","", icon = icon("globe"))
with the CSS:
#gobackhome {
  position: absolute;
  z-index: 10;
  top: 70px;
  left: 10px;
  box-shadow: rgba(0, 0, 0, 0.65098) 0px 1px 5px 0px;
  padding: 4px 6px;
  }
so it would be just under the zooms.
Interactivity
I added two ways to query the data:
- Click on the map to get the location
I couldn't find any documentation on the event name for the map click on a topojson file (the click on marker or shapes are documented, but not for topojson). I tried my luck with map_topojson_click and was pleasantly surprised it worked! So I made an observeEvent:
observeEvent(input$map_topojson_click,{
    output$location_topojson <- renderUI({
      gov <- paste("<b>Governate</b>: ", input$map_topojson_click$properties$Governorat)
      district <- paste("<b>-> District</b>: ",input$map_topojson_click$properties$District)
      subdistrict <- paste("<b>--> Sub district</b>: ",input$map_topojson_click$properties$Subdistric)
      HTML(paste(gov, district, subdistrict, sep = '<br/>'))

    })
})
For the city, the popup was very easily to encode with popup=cities$Community when creating them.
- Select the location
Largely inspired by this blog post, I added some interactivity to the map with an observer to the map click. The principle is to create an empty layer of points (pt_selected) with a style that stands out (e.g. color and size), and to dynamically add and remove the point that should be highlighted or not.
pt_selected <- function(map, x, y) addCircleMarkers(map, x, y, radius=6, color="black", fillColor="orange", fillOpacity=1, opacity=1,  weight=2, stroke=TRUE, layerId="Selected")

observeEvent(input$Map_marker_click, {
    p <- input$Map_marker_click
    proxy <- leafletProxy("map")
    if(p$id=="Selected"){
      proxy %>% removeMarker(layerId="Selected")
    } else {
      proxy %>% setView(lng=p$X, lat=p$Y, 12) %>% pt_selected(p$X, p$Y) #replaced input$Map_zoom by 3
    }
})
The points are highlighted by two successive drop-down boxes: the first one selects a governorate, and the second a city within that governorate. I also added a layer of points representing the center of the polygons, and zoom on these when the governorate is selected. I think it would be better to use the bounding box, but I just selected a zoom and the center instead.
Side panel
I made a side panel to display all the tools specific to the interface: exploring locations, uploading files, and exploring the file. Each tool is on a tab; Shiny makes the creation of such tabs very easy.
- Exploring locations
The map can be explored in two ways:
-
Click on the map gives a location: governorate, district and subdistrict. That's where using a topojson file with combined files comes in really handy: since it's the same object, we only need to query one layer for three different attributes.
-
Location selected in the successive dropdowns zooms to their location on the map
-
Select a location
On the 'Explore' tab of the panel, there are two drop downs: the first one for the governorates, and the second one for the cities. When a governorate is selected, the cities in the second drop down are the subset of cities in that governorate.
Speeding up the map
To make an interface that is well defined (good geographic data) but also easy to navigate, I used the following specifications:
- Use point data as often as possible (for small cities)
- Use topojson
- Simplify geographic data
-
load the data after the basemaps are loaded:
:::R session$onFlushed(once=TRUE, function() { leafletProxy("map") %>% addTopoJSON(neighbourhoods, weight = 1, color = "red",fillOpacity = 0.2,group ="Neighbourhoods" ) %>% addTopoJSON(syria, weight = 1, dashArray="15, 10, 5", color = "#444444",fillOpacity = 0.01,group ="Admin. borders" ) %>% addCircleMarkers(cities$X,cities$Y,color="navy",popup =cities$Community,radius = 3,stroke = FALSE,fillOpacity = 0.5,group="Communities") })
Using Shiny
Shiny language
Shiny was developed to enable quick development of webpages without knowledge of HTML/CSS/JavaScript. This is true for very simple apps: it is pretty fast to create simple interactions between the data and the visualisation. However, beyond very simple interactions, either it becomes more complex and programmers need to understand basic concepts of interactive coding (some questions on stackoverflow are very very basic and show that many programmers jump into shiny without understanding simple concepts of interactions), or it simply requires to add some JavaScript. That defeats a little bit the point of coding a shiny app - why not writing in JavaScript from the start? ]Unless R code is intensively used, it might be better to learn to use JavaScript. Especially when you know JavaScript already, learning the observer/reaction events can feel a bit like a waste of time.
Shiny is also evolving pretty quickly: for instance there used to be only an observe function, and so "observe" only one event, the code had to include if (is.null(value)) return(NULL), but now Shiny includes observeEvent for specific events.
From my experience in Copenhagen University, where the statistics department develops apps for non R users, and videos watched on Youtube, it sounds like a large part of developers are actually spending a lot of time on developing apps. So they are akin to professional coders.. why not learning JavaScript? That's not really a serious question, but I wonder if creating a meta-language was really necessary. I guess that's what most people do anyway! JavaScript on top of Shiny. It's not very performant, but for performance I don't know of anything that beats D3.
shinyapp.io
The webplatform shinyapp.io is meant to easily publish shiny based apps online. The free version gives 5 apps available 25 hours per month. That's a good offer (since it's free!), although I find the time restriction very limiting for (semi)-professional apps. On the performance side, the applications are very very slow and I wonder if it wouldn't be easier to use a dedicated service for that, even paying.
Conclusion
Shiny is an easy-to-use language in order to quickly provide some interface for anyone to use R-based analysis. This means that non-R users can have access to interfaces without learning R, and makes it easier for R coders to discuss with non-technical people. Anything more complex requires some knowledge of JavaScript, but being able to use R functions on the fly in a browser is really interesting!
Have a look at my app here, and tell me what you think!
Related posts
-
Tropical Neglected Disease
Analysis of global trends in Tropical Neglected Diseases. Cluster and spatial analysis using R. Visualisation on Carto, R, and Tableau.