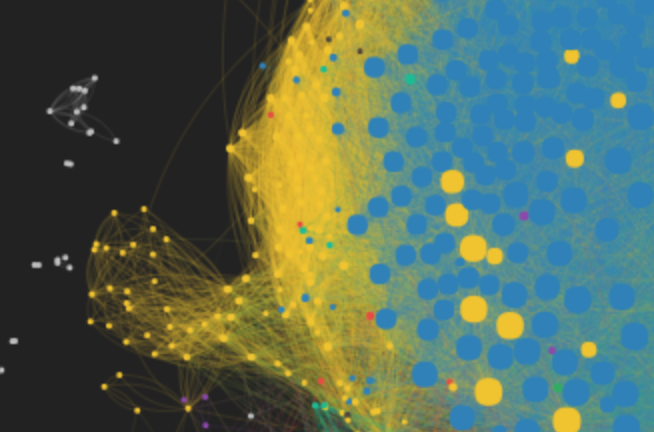
Data science w/ a geo bias

Data science w/ a geo bias

Hélène Draux

  • home \
  • About \
  • Contact \
  • www
  • |

Welcome to my geo tech blog, where you can read about some of my projects.

  • All
  • #analysis
  • #Bokeh
  • #carto
  • #cartodb
  • #css
  • #epidemiology
  • #facebook
  • #gephi
  • #GIS
  • #Google Maps API
  • #javascript
  • #jupyter
  • #leaflet
  • #matplotlib
  • #network
  • #NLTK
  • #notebook
  • #pandas
  • #pelican
  • #platform
  • #python
  • #R
  • #Shiny
  • #spatial analysis
  • #Tableau
  • #udacity
  • #Visualisation

Building a network (Part 1)

  • #python #pandas #network #gephi
Building a similarity network to analyse in Gephi - built for a dataviz competition
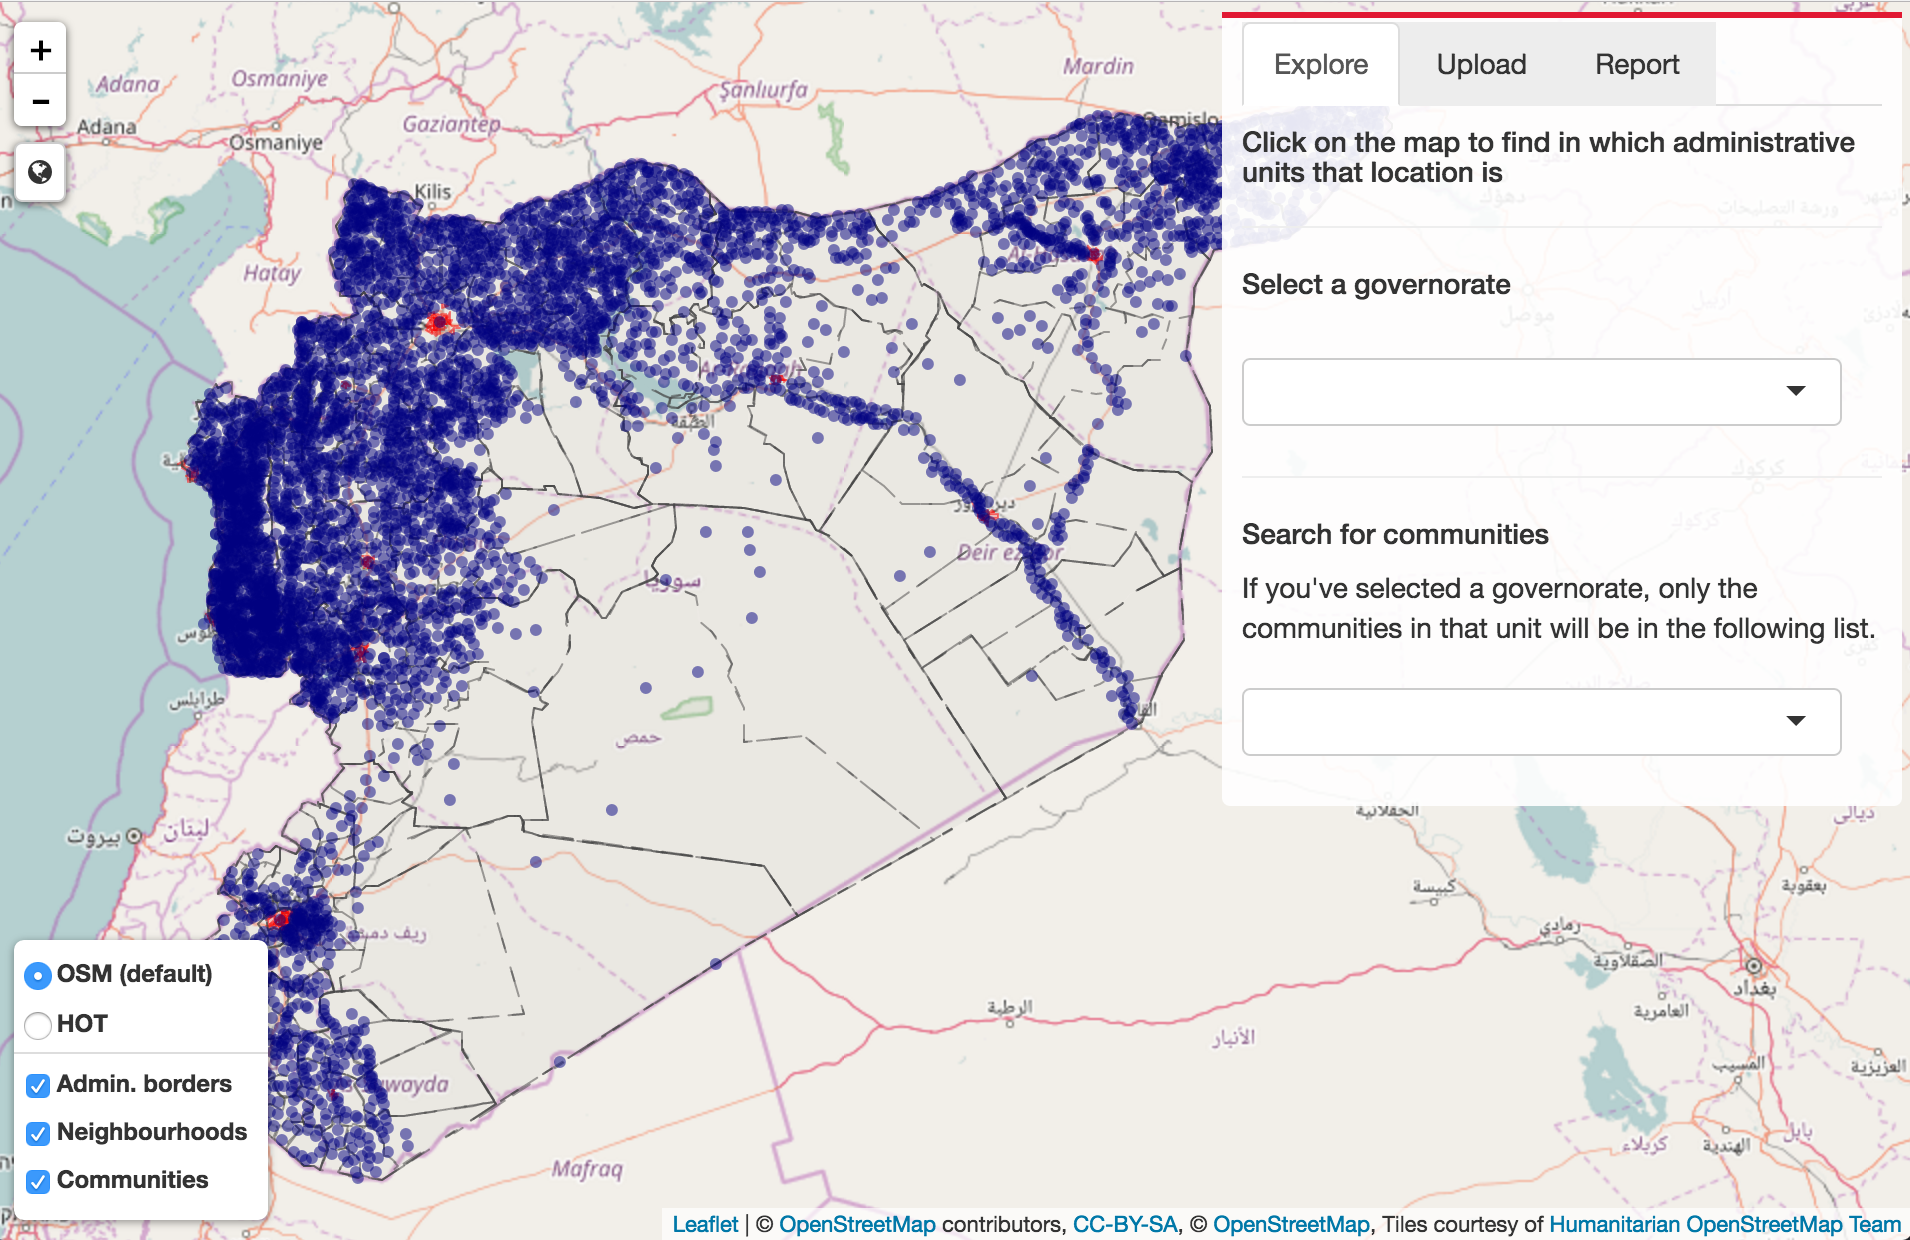
locationnewoffice

  • #GIS #spatial analysis #python #Google Maps API

Shiny map interface

  • #R #Shiny #platform #Visualisation
Shiny interface to explore places in Syria and upload excel file containing locations. Filters and time slider.
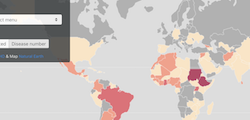
Tropical Neglected Disease

  • #R #epidemiology #carto #Tableau
Analysis of global trends in Tropical Neglected Diseases. Cluster and spatial analysis using R. Visualisation on Carto, R, and Tableau.
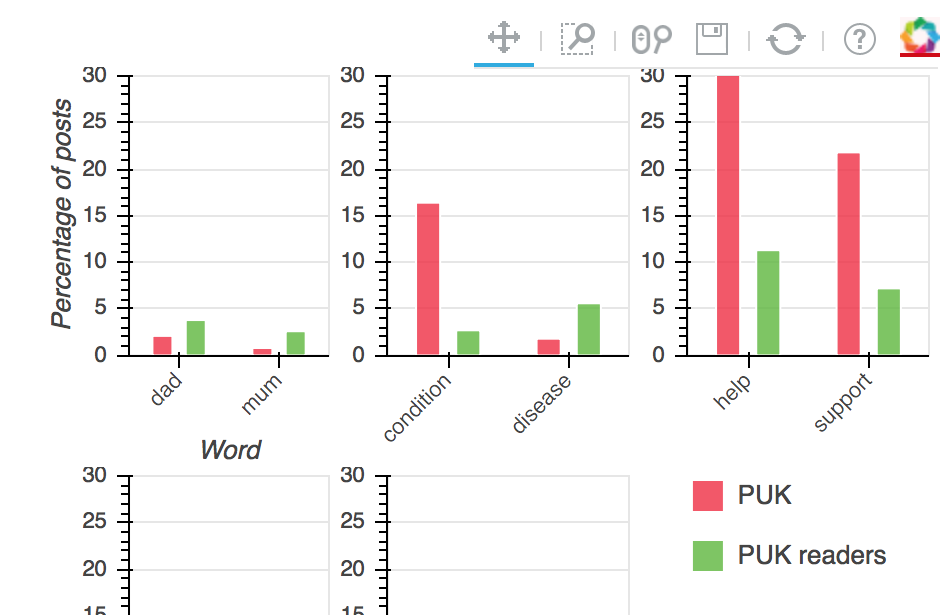
NLP of a Facebook Page

  • #python #facebook #analysis #pandas #NLTK #Bokeh
Analysis of Parkinson's UK Facebook Page using pandas, NLTK, and Bokeh.

Tips using Jupyter to publish on a blog

  • #jupyter #notebook #python #css

"Reveal Code" button on Jupyter

  • #pelican #jupyter #javascript

import from the __future__

  • #python

Tkinter in Mac

  • #python #matplotlib #udacity

Saving/Exporting CartoDB map as jpeg.

  • #cartodb #leaflet #javascript

Built w/ Pelican / inspired by ✨